Telstra Incubation - Melbourne, Australia
Telstra Supply Chain International Visibility
Background
Telstra Supply Chain Visibility (TSCV) solution is for teams managing complex inbound or outbound supply chains. It offers one source of truth to track and strategically analyse the journey of freight anywhere in the world, regardless of carrier or mode of transport. The TSCV solution seamlessly brings together data from across your supply chain (IoT data, operational data, open data, partner data, etc.) to intelligently predict and alert you when your freight is off track. The TSCV solution helps you to rescue your delivery on time stats, cut costs and improve your forecasting ability for stock in transit.
My Role
My role was Lead UX & product design. I collaborated with developers and enterprise representatives. We built an MVP in initial 90 days and launched successful trials with 3 customers within the first 6 months and showcased our work during Telstra Vantage – Technology and innovation Expo in Australia.
Process
*Images were blurred due to privacy
Once the market research had been synthesised, the key pain points emerged resulting in first hypothesis statements which I then started validating through discovery interviews with users representing different logistic roles. Questions were focused on understanding users’ workflow, pain points, needs, and their everyday tools.
Learnings & User World
Key learnings were on how complex and overwhelming the world of the logistic operators is. The whole supply chain consists of interconnected and interdependent players who don’t use standardised formats of data or a single way of communicating. Users experience portal fatigue. The main tools are Excel documents, phone calls and emails without standardised formats of data. They spent multiple hours on navigating issues around single purchase orders which results in lack of visibility, reactive behaviour and endless hours spent on chasing the relevant information.
Point of view
Synthesis of the interviews allowed me to form an initial perspective and build out first set of wireframes that became a conversation starter for further discoveries around needed features with end users.
Pivotal discovery
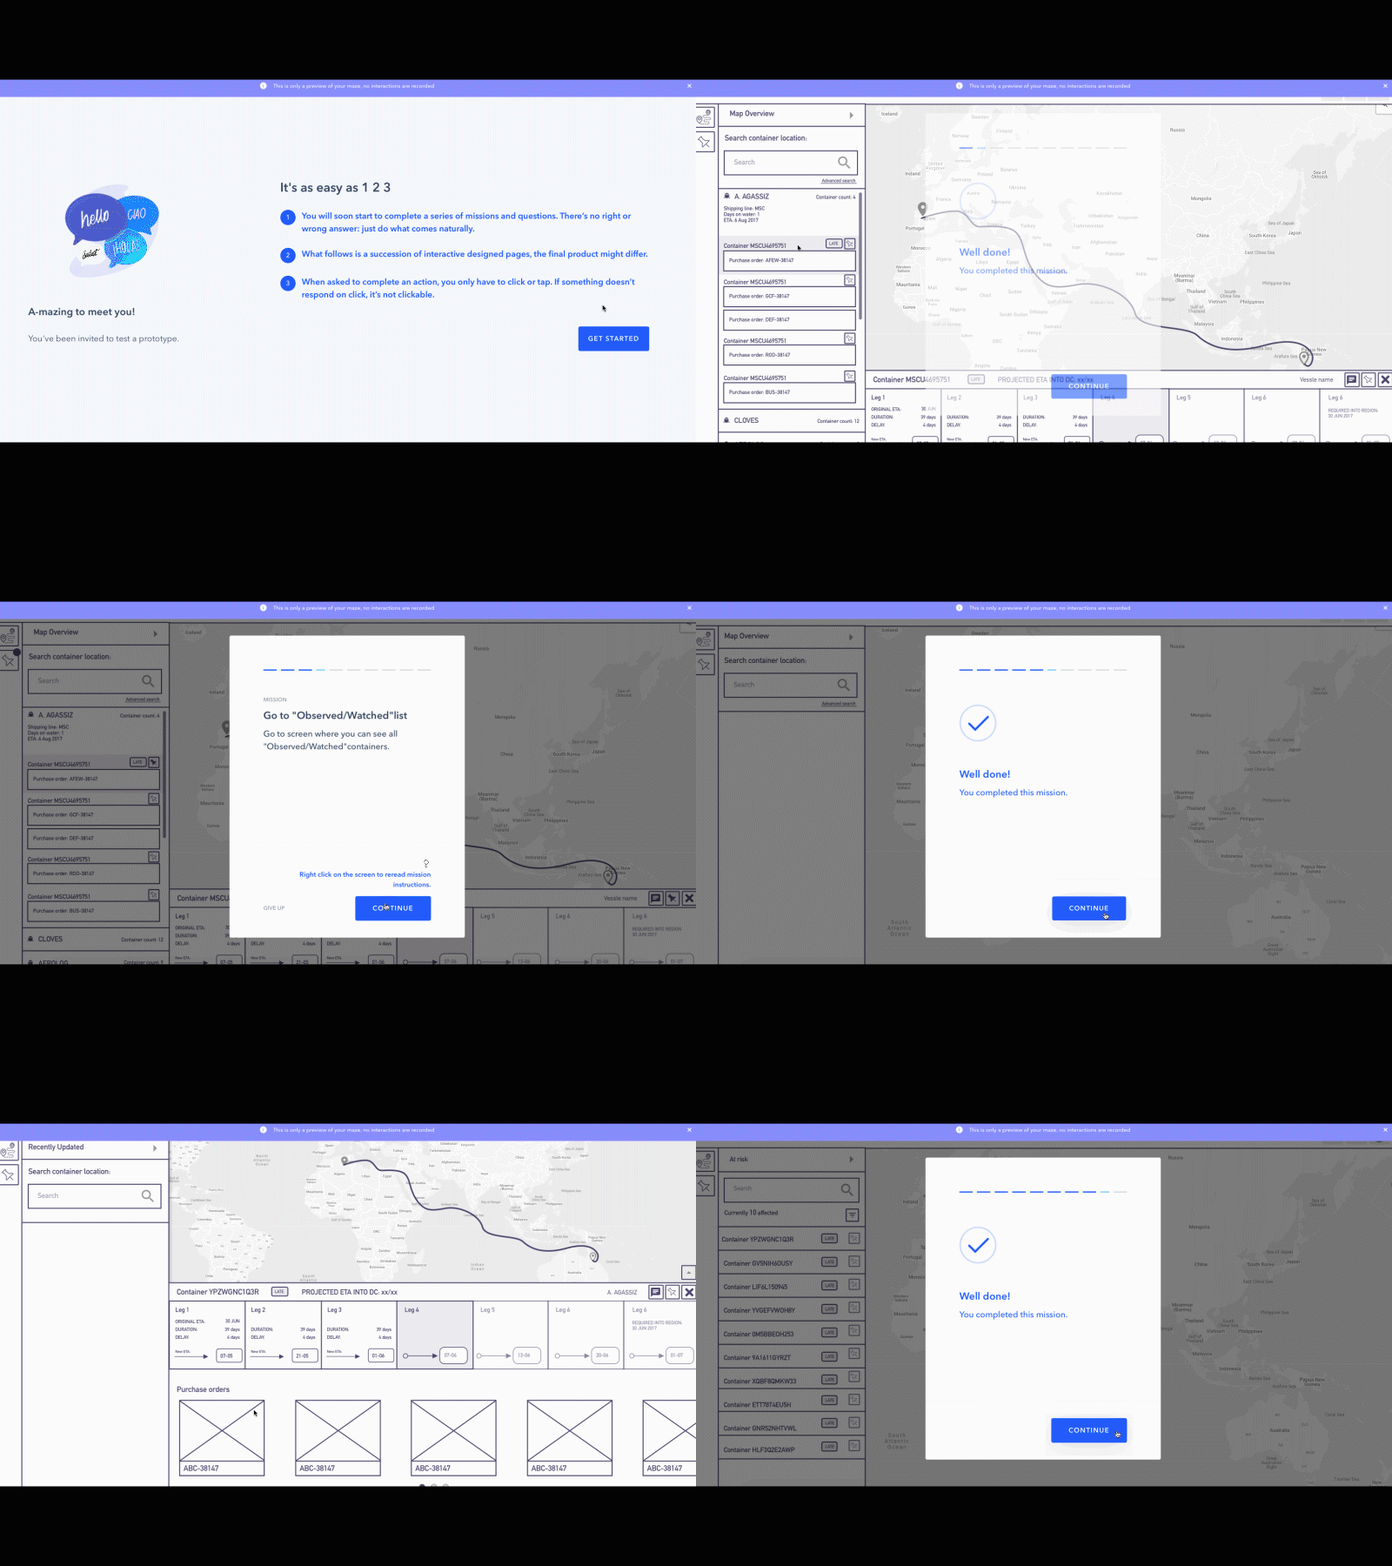
First set of conversations indicated big map feature as a hero component of the tool. During the following series of the testing (Maze – low-fi InVision prototype with defined user tasks I observed that users were ignoring the map and were searching for the information in a more traditional format. Following that observation, I suggested the pivot of the layout by removing map and bringing focus to the information essential to users.
Next series of testing of the updated version of the layout confirmed my conclusion and resulted in reaching goal successfully by users without requesting or needing a map.
Understanding reasoning
The layout needed to be filled with the most relevant and accurate set of data that would allow users to complete their everyday tasks.
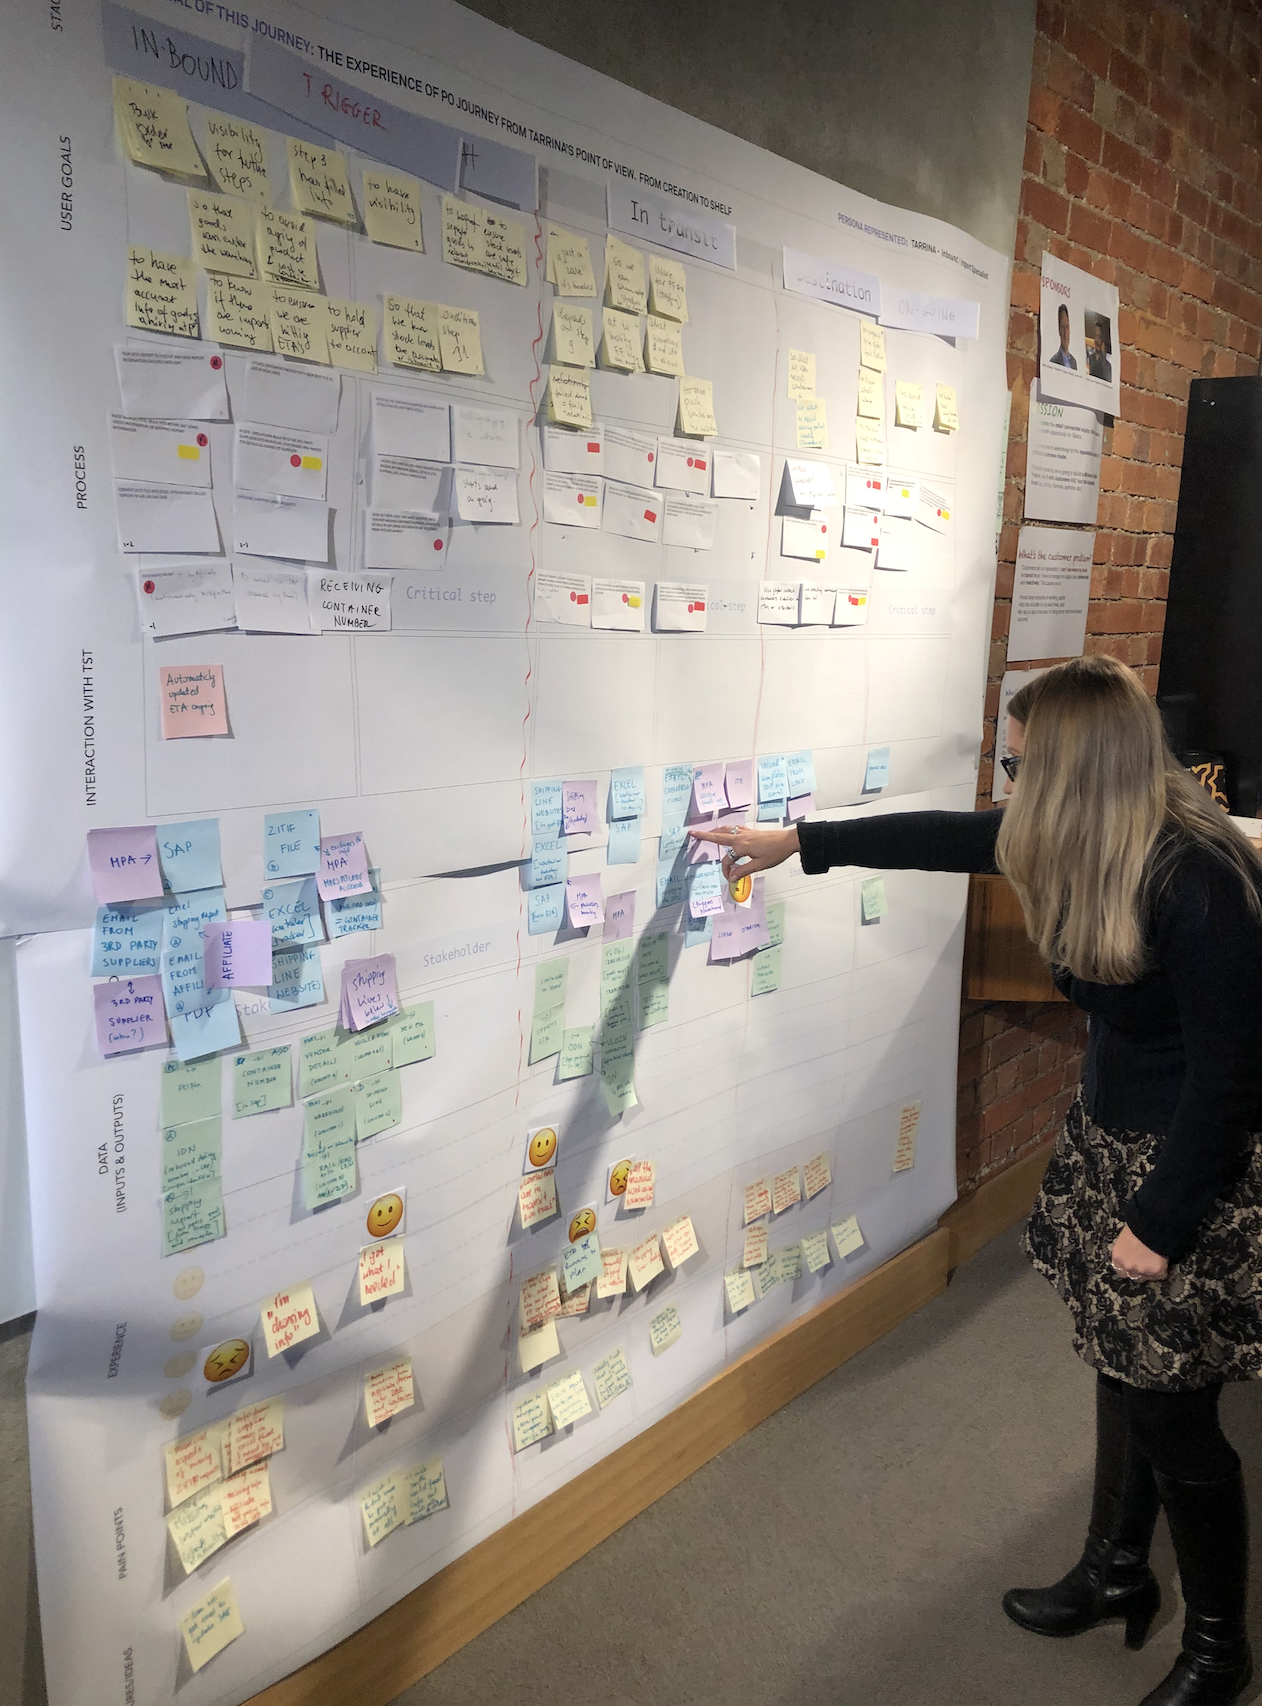
In order to learn about these tasks; the activities like the ‘Jobs To Be Done’ and Customer Journey workshops were conducted with users. That uncovered the most actionable steps in the users daily workflow and indicated data sets that trigger actions. After visually interpreting the data, it was incorporated into the UI in the form of ‘smart time line’ and Purchase Order summary with prediction of delayed and early freight, with possibility to filter and sort the results.
Optimising for Personas
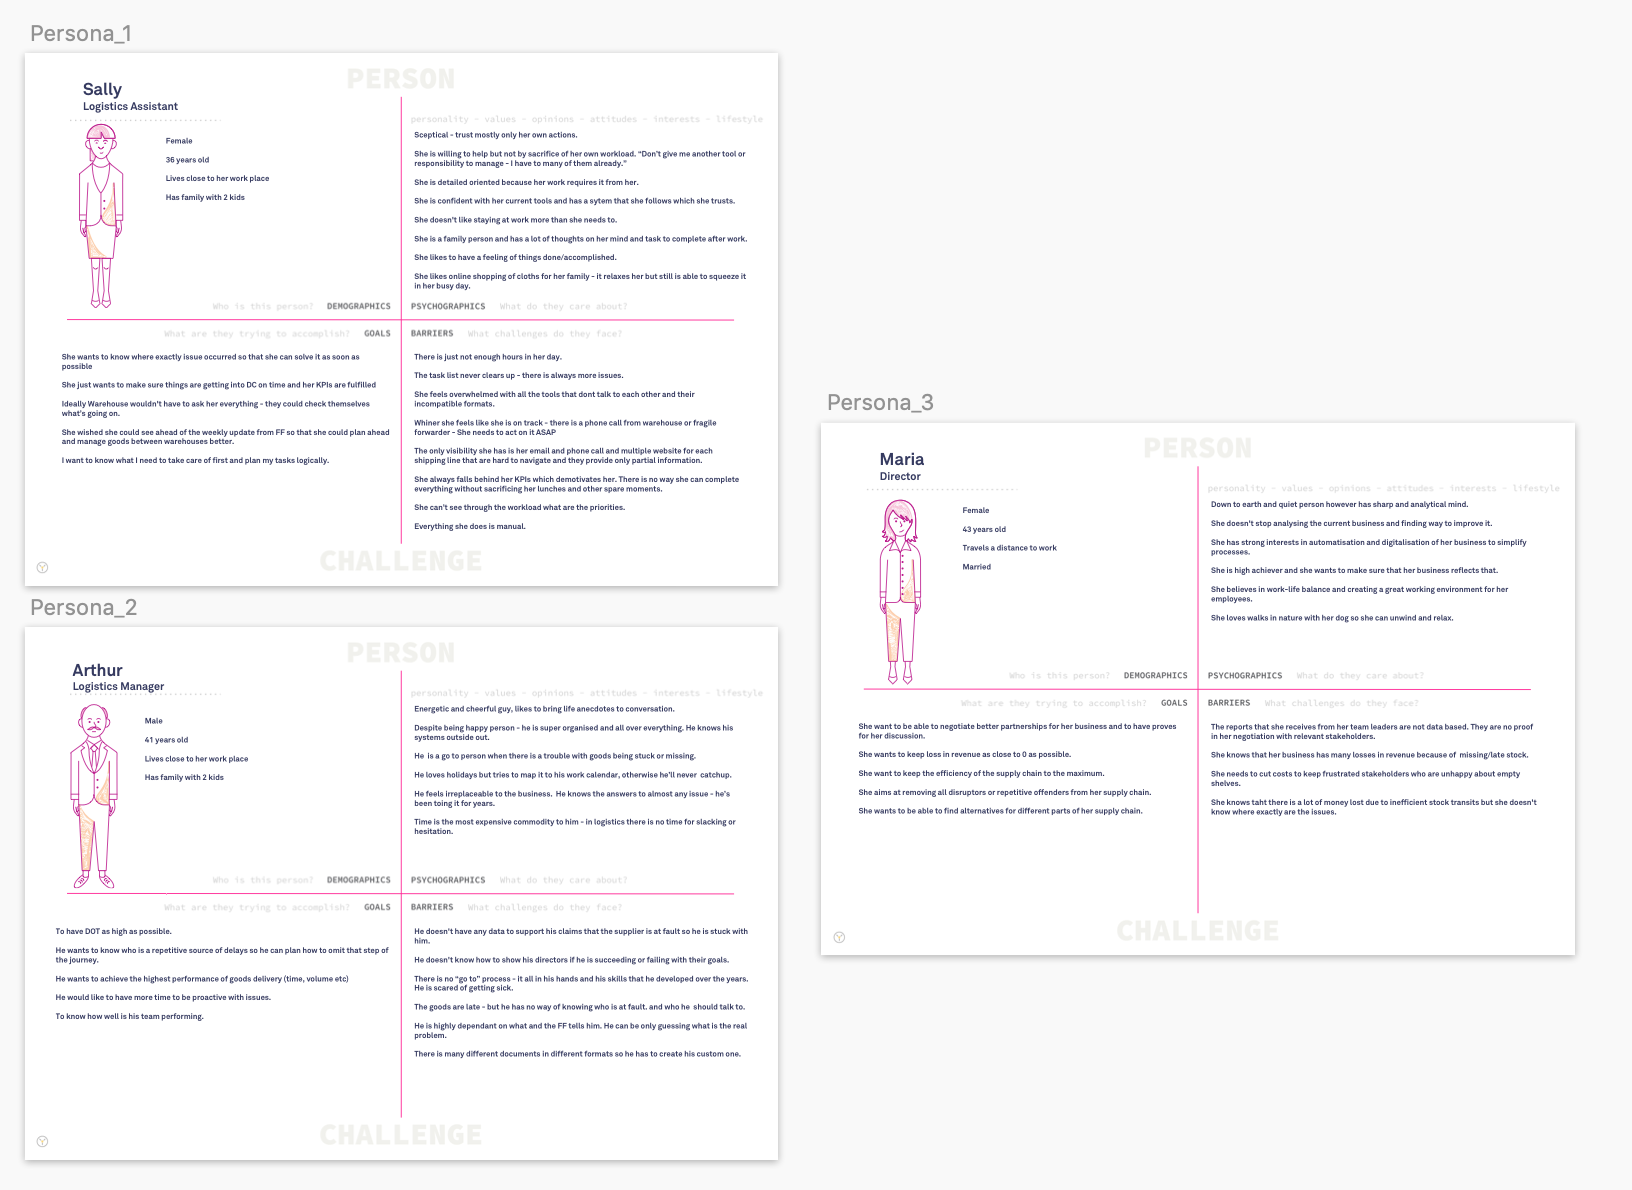
Throughout interaction with our clients the proto personas have been created. With every iteration we were optimising the TSCV tool for needs of each persona.
The proto personas that were identified:
Operator – key goal is to look forward and to be able to identify problems with fright ahead of time,
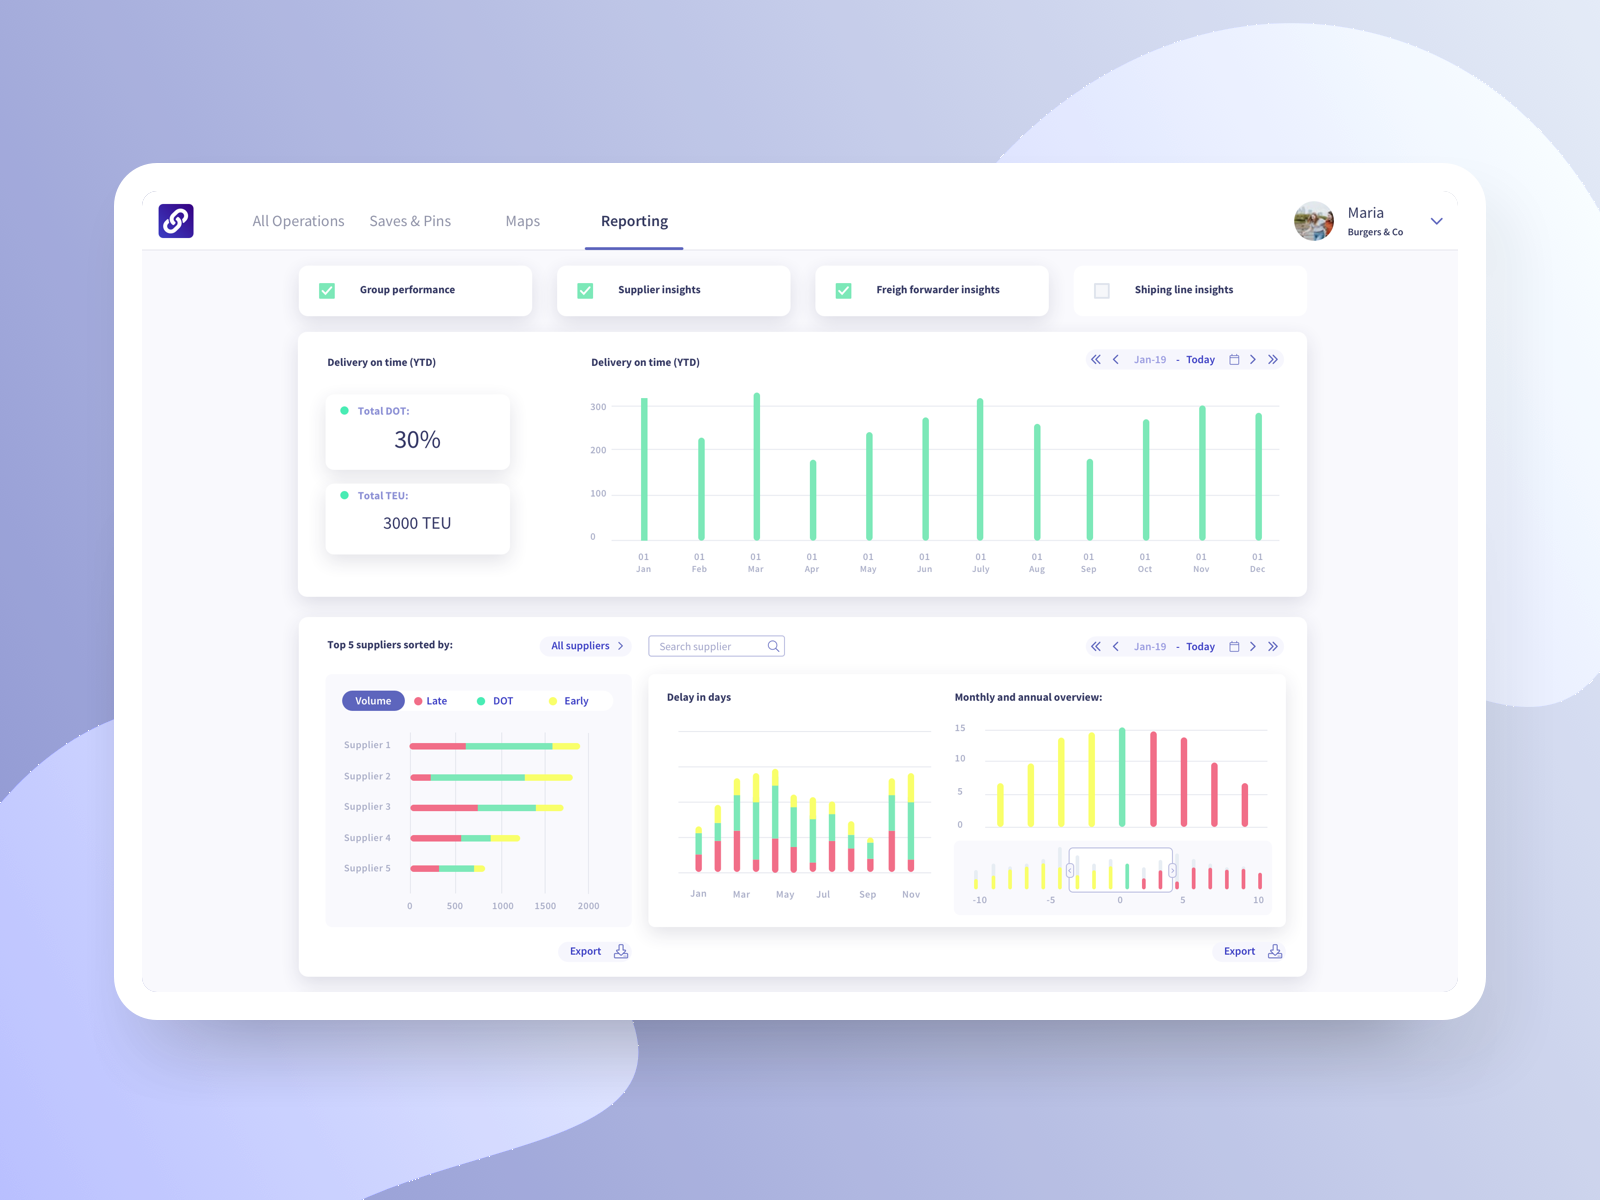
Manager – Manager looks backward, trying to understand what went wrong. Is interested in high level insights (reporting) to be able to measure team performance against key KPIs
Director – Interested in strategic insights (reporting). Wants to know trends in performance of their stakeholders and have an ability to perform collaborative, data-driven conversations.
Timeline evolution
Best of interative approach to design development we were able to arrive at simplified solution of the most important milestones. Originally through the workshop with the users I managed to identify all the milestones of the freight journey that operational assistant will track. Next, I tried to identify only actionable milestones to understand which one of them trigger actions that will later serve as a base for designing notifications. Finally, milestones have been grouped where possible and language standardised, bringing even more siplification while maitaining all valuable insights.
Feedback loop
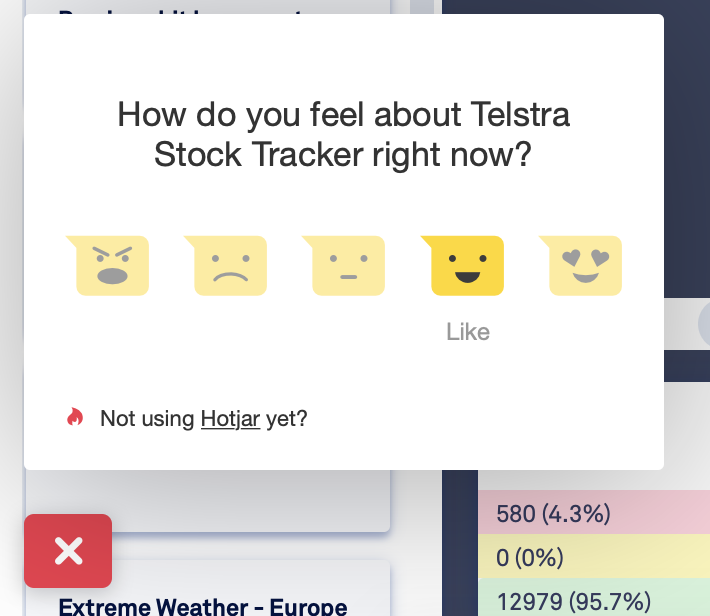
I implemented HotJar into the MVP to enable easy, inside the tool users’ feedback sharing. Additionally there were weekly user calls scheduled and their feedback was captured in the list via Coda. Regular testing and frequent iterations based on shared feedback were part of every sprint.
Back to map
Interesting design change was driven by business needs and resulted in bringing back boosted map feature that became a marketing and demo tool used for the visualisation of the complexity of the data that is driving the tool. It enabled story telling around the product and facilitated conversations with our clients’ board representatives.
Success metrics
In order to define that early MVP was successful the following metrics were used: 1. Time spent on navigating to relevant purchase order (1-3h down to 30sec) 2. Time spent on understanding the source of the issue. (2—4h down to 30 sec-40min) 2. The number of documents/portals needed to find the answer (4-7 down to 1-2).
Stakeholders
The project required of me interaction with various stakeholders and working closely with Business Model Canvas so that the product that was designed was not only empathetic with user needs, but also aligned with business objectives. I got to participate in customers’ meetings, initial engagements, clients’ mapping and of course presenting designs to our project sponsors.
Initial feature mapping
User Flow sketches (draft)
Flow of the MVP up to date.


